
What is it?
As experts, the conceptual landscape in our course material is clear to us—how big ideas frame the field, important distinctions and overlaps among them, and the web of relationships that makes our course a story worth telling. Unfortunately, our over-familiarity with the material can create “expert blind spots” (Nickerson, 1999) and it can be easy for us to forget that students haven’t yet had the chance to build these layers of connection. Their struggle to discover the deeper themes and relationships that we want them to see can sometimes surprise us. We may try adding language to our syllabus to help them make these larger connections, but the syllabus is linear in nature and often these relationships demand a more complex form of delivery than the sequential nature of written language. Many educators are now discovering the many-faceted value of a “Course Graphic.”
Some Research
It turns out that a picture may indeed be worth a thousand words: the “picture superiority effect” has been well-documented by perception psychologists as a mechanism for efficient delivery of information through reduced cognitive load (Paivio & Csapo, 1973). It may not surprise you that the “attentional capture” effect of images compared to words can lead to deeper processing of the information embedded in the picture (Rosengrant, Hearrington, Alvarado & Keeble, 2012). Finally, visual conventions like spatial proximity to represent affiliation and arrows to represent direction or movement seem to be culturally universal (Tversky, 1995), which is a boon to our increasingly global classrooms.
CATLR Tips
- Develop course graphics with a cross-disciplinary “buddy”: Explaining your course to someone outside your discipline can require you to make explicit the themes and connections that are often tacitly understood by disciplinary insiders. This is exactly the kind of information that should go on a course graphic.
- As they describe their course, watch your “buddy” move their hands: Gestures are visualizations-in-the-moment, and when describing course material and its relationships, your colleague is likely to use their hands to “lay out” ideas in relation to one another. Be sure to capture the patterns of those movements for reflection back to your partner to inform the development of their course graphic.
- Walk through the course graphic with your students early and often: Make your course graphic prominent in your syllabus and explain the ideas and relationships represented as you walk through the syllabus on the first day. Then return to the graphic at important milestones across the semester to help students make the “big picture” connections and help them build the deeper, more thematic knowledge that you know to be the foundation of the course.
References
Nickerson, R. (1999). How we know—and sometimes misjudge—what others know: Imputing one’s own knowledge to others. Psychological Bulletin, 125(4), 362-396.
Pavio, A., & Csapo, K. (1973). Picture superiority in free recall: Imagery or dual coding?. Cognitive Psychology, 5, 176-206.
Rosengrant, D., Hearrington, D., Alvarado, K., & Keeble, D. (2012). Following student gaze patterns in physical science lectures. AIP Conference Proceedings 1413(1), 323-326.
Tversky, B. (1995). Cognitive origins of graphic conventions. In F. T. Marchese (Ed.), Understanding images (29–53). New York: Springer-Verlag.
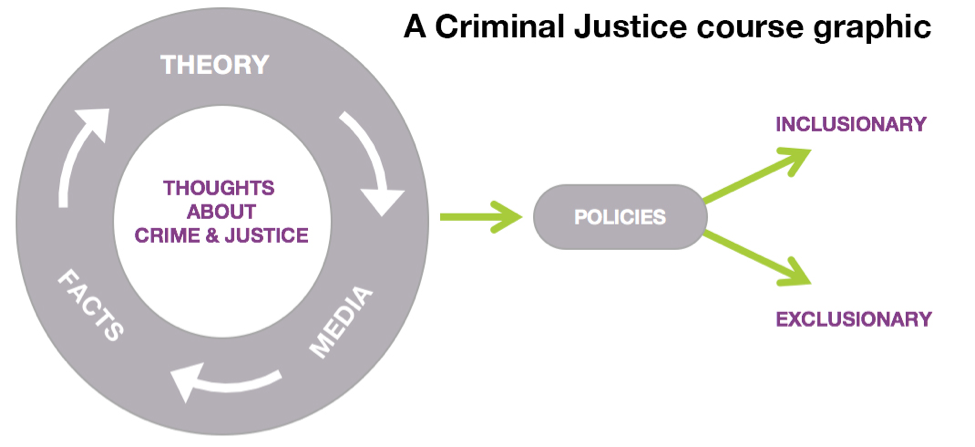
Singer, S. (2016). Criminal Justice Course Graphic.